Illustrative Math - Algebra 2 - Unit 7 - Lesson 15
By Formative Library
starstarstarstarstar
Last updated about 1 year ago
12 Questions
1
1.
Clare analyzes oil prices in her economics class. She finds that the mean oil price between 1988 and 2002 is $27 per barrel with a standard deviation of $5.50 per barrel. Select the z-score for a price of $38 per barrel.
S.IC.5
S.ID.4
1
2.
Priya is investigating the population density of deer in several different forests. The mean population density is 36.4 deer per square mile with a standard deviation of 4.6 deer per square mile.
Use the z-score for 43.3 deer per square mile and the table to find the area under the normal curve that is less than 43.3 deer per square mile.
S.IC.5
S.ID.4

1
3.
1
4.
1
5.
1
6.
1
7.
1
8.
Noah is working on a science experiment. He wants to determine how the temperature in a pool affects the chlorine level. Noah visits 16 pools and adjusts the chlorine levels so that they are all at 2.5 parts per million. After two days, he collects 8 samples from pools that are 78 degrees and 8 samples from pools that are 84 degrees. He measures the chlorine level in each sample. He finds that the difference in mean chlorine levels for the groups is 0.6 parts per million.
Noah writes a computer program to recombine all the data into all 12,870 possible different groupings and finds that 2,612 of the different groupings have a difference in means of at least 0.6 part per million. Is there enough evidence for Noah to conclude that the difference in means is due to the pool temperature? Explain or show your reasoning.
S.IC.5
S.ID.4
1
9.
The daily step count of 25 random samples of 40 people each are measured. The mean for each sample is included in the dot plot.
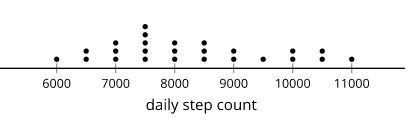
Use the values to estimate the mean step count for the population. What is the margin of error for this estimate based on these values? (Round to the nearest step.)
S.IC.5
S.ID.4

1
10.
1
11.
1
12.
This lesson is from Illustrative Mathematics. Algebra 1, Unit 7, Lesson 15. Internet. Available from https://curriculum.illustrativemathematics.org/HS/teachers/3/7/15/index.html ; accessed 29/July/2021.
IM Algebra 1, Geometry, Algebra 2 is © 2019 Illustrative Mathematics. Licensed under the Creative Commons Attribution 4.0 International License (CC BY 4.0).
The Illustrative Mathematics name and logo are not subject to the Creative Commons license and may not be used without the prior and express written consent of Illustrative Mathematics.
These materials include public domain images or openly licensed images that are copyrighted by their respective owners. Openly licensed images remain under the terms of their respective licenses. See the image attribution section for more information.