Illustrative Math - Algebra 2 - Unit 7 - Lesson 12
By Formative Library
starstarstarstarstar
Last updated about 1 year ago
5 Questions
1
1.
Select all of the values for the population mean that would be plausible based on an estimate of 105 cm with a margin of error of 21 cm.
S.IC.4
1
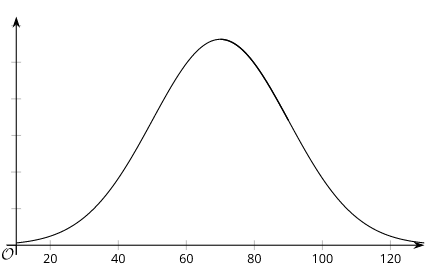
2.
A normal curve with a mean of 70 and a standard deviation of 20 is shown. Shade the region under the curve between the mean and one standard deviation greater than the mean. How much of the data falls within the shaded region?
S.IC.4
1
3.
Noah and Clare are studying the noise level, in decibels, outside of their school in the morning. They sample in 15 minute time periods in the morning to determine whether the noise level reaches 90 or more decibels. They each take a random sample to find the proportion of 15 minute time periods where the noise level reaches 90 or more decibels. Noah's sample contains 12 fifteen minute time periods, and Clare’s sample contains 25 fifteen minute time periods.
After collecting data, they run 200 simulations each to determine an estimate for the proportion of the 15 minute time periods where the noise level reaches 90 or more decibels. How do you think Noah's reported margin of error compares to Clare’s? Explain your reasoning.
S.IC.4

1
4.
1
5.
This lesson is from Illustrative Mathematics. Algebra 1, Unit 7, Lesson 12. Internet. Available from https://curriculum.illustrativemathematics.org/HS/teachers/3/7/12/index.html ; accessed 29/July/2021.
IM Algebra 1, Geometry, Algebra 2 is © 2019 Illustrative Mathematics. Licensed under the Creative Commons Attribution 4.0 International License (CC BY 4.0).
The Illustrative Mathematics name and logo are not subject to the Creative Commons license and may not be used without the prior and express written consent of Illustrative Mathematics.
These materials include public domain images or openly licensed images that are copyrighted by their respective owners. Openly licensed images remain under the terms of their respective licenses. See the image attribution section for more information.