Illustrative Math - Algebra 2 - Unit 7 - Lesson 6
By Formative Library
starstar
Last updated about 1 year ago
9 Questions
1
1.
A normal curve with a mean of 500 and a standard deviation of 100 is shown. Shade the region under the curve within one standard deviation of the mean. How much of the data falls within the shaded region?

S.ID.4
S.ID.1
G.GPE.7
1
2.
The stopping distance of a certain car traveling at 60 miles per hour follows an approximately normal distribution with a mean of 130 feet and a standard deviation of 5 feet.
Approximately what percent of the time does the car stop at a distance of between 120 feet and 140 feet?
S.ID.4
S.ID.1
G.GPE.7

1
3.
1
4.

1
5.
1
6.
1
7.
1
8.
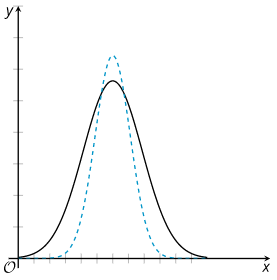
Two curves representing normal distributions are shown. Does the solid curve or dashed curve have a greater standard deviation? Explain how you know.
S.ID.4
S.ID.1
G.GPE.7
1
9.
Why is it important to randomly assign people to random groups in an experimental study?
S.ID.4
S.ID.1
G.GPE.7
This lesson is from Illustrative Mathematics. Algebra 1, Unit 7, Lesson 6. Internet. Available from https://curriculum.illustrativemathematics.org/HS/teachers/3/7/6/index.html ; accessed 29/July/2021.
IM Algebra 1, Geometry, Algebra 2 is © 2019 Illustrative Mathematics. Licensed under the Creative Commons Attribution 4.0 International License (CC BY 4.0).
The Illustrative Mathematics name and logo are not subject to the Creative Commons license and may not be used without the prior and express written consent of Illustrative Mathematics.
These materials include public domain images or openly licensed images that are copyrighted by their respective owners. Openly licensed images remain under the terms of their respective licenses. See the image attribution section for more information.