Illustrative Math - Algebra 2 - Unit 7 - Lesson 10
By Formative Library
Last updated about 1 year ago
7 Questions
1
1.
A scientist captures a sample of fish from 100 different locations along the Yellowstone river and measures the proportion of fish affected by copper toxicity for each sample.
Describe how the scientist could use the data to estimate the proportion of fish affected by copper toxicity in the entire population along this portion of the river.
S.IC.4
S.IC.6

1
2.
1
3.
1
4.
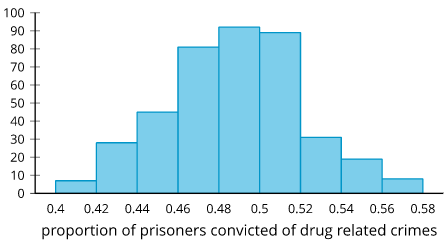
A researcher uses a random sample of 200 people in prison in the United States to find that the proportion of the prison population that is jailed for drug-related crimes is 0.485. The researcher simulates selecting a sample of 200 prisoners, each with a 48.5% chance of being in prison for drug-related crimes. The simulation is run 400 times, and the results are shown in the histogram. Use the histogram and information from the original sample to estimate the proportion of prisoners in the United States that is in prison for drug-related crimes. Be sure to include a margin of error with your estimate.
S.IC.4
S.IC.6
1
5.
A pizza company is interested in the average number of pizzas eaten each year by people. They send out 30 volunteers to conduct research by collecting random samples of 25 people each and determine the number of pizzas that the people in the group ate in the previous year. After looking at the sample means, the company estimates that the mean number of pizzas eaten is 6.4 with a margin of error of 1.3.
Based on these values, what interval is likely to contain the true mean number of pizzas eaten in the previous year by the population?
S.IC.4
S.IC.6
1
6.
Based on surveys of random samples from students at a university, the proportion of university students interested in a new chain restaurant opening on their campus is 0.62 with a standard deviation of 0.04.
Which of these intervals is the smallest that likely contains 95% of the sample proportions?
S.IC.4
S.IC.6
1
7.
Kiran collects information about 25 classmates. He believes his data set is perfectly symmetrical with a mean and median of 6. He then realizes that the number he has recorded as 12 was actually supposed to be 10.
What is true about the mean and median of his corrected data set?
S.IC.4
S.IC.6
This lesson is from Illustrative Mathematics. Algebra 1, Unit 7, Lesson 10. Internet. Available from https://curriculum.illustrativemathematics.org/HS/teachers/3/7/10/index.html ; accessed 29/July/2021.
IM Algebra 1, Geometry, Algebra 2 is © 2019 Illustrative Mathematics. Licensed under the Creative Commons Attribution 4.0 International License (CC BY 4.0).
The Illustrative Mathematics name and logo are not subject to the Creative Commons license and may not be used without the prior and express written consent of Illustrative Mathematics.
These materials include public domain images or openly licensed images that are copyrighted by their respective owners. Openly licensed images remain under the terms of their respective licenses. See the image attribution section for more information.