Open Up - Grade 7 - Mathematics - Unit 8 - Lesson 18
By Formative Library
starstarstarstarstar
Last updated over 2 years ago
7 Questions
1
1.
Lin wants to know if students in elementary school generally spend more time playing outdoors than students in middle school. She selects a random sample of size 20 from each population of students and asks them how many hours they played outdoors last week. Suppose that the MAD for each of her samples is about 3 hours.
Select all pairs of sample means for which Lin could conclude there is a meaningful difference between the two populations.
7.SP.4
7.SP.3
6.SP.5.c
1
2.
These two box plots show the distances of a standing jump, in inches, for a random sample of 10-year-olds and a random sample of 15-year-olds.

Is there a meaningful difference in median distance for the two populations?
7.SP.4
7.SP.3
6.SP.5.c
1
3.
The median income for a sample of people from Chicago is about $60,000 and the median income for a sample of people from Kansas City is about $46,000, but researchers have determined there is not a meaningful difference in the medians.
Explain why the researchers might be correct.
7.SP.4
7.SP.3
6.SP.5.c
1
4.
A farmer grows 5,000 pumpkins each year. The pumpkins are priced according to their weight, so the farmer would like to estimate the mean weight of the pumpkins he grew this year. He randomly selects 8 pumpkins and weighs them. Here are the weights (in pounds) of these pumpkins:

Estimate the mean weight of the pumpkins the farmer grew.(Round to the nearest whole number)
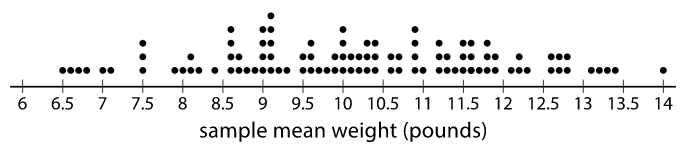
This dot plot shows the mean weight of 100 samples of eight pumpkins, similar to the one above.
7.SP.4
7.SP.3
6.SP.5.c
1
5.
A farmer grows 5,000 pumpkins each year. The pumpkins are priced according to their weight, so the farmer would like to estimate the mean weight of the pumpkins he grew this year. He randomly selects 8 pumpkins and weighs them. Here are the weights (in pounds) of these pumpkins:
This dot plot shows the mean weight of 100 samples of eight pumpkins, similar to the one above.
What appears to be the mean weight of the 5,000 pumpkins?(round to the nearest whole number)
7.SP.4
7.SP.3
6.SP.5.c
1
6.
A farmer grows 5,000 pumpkins each year. The pumpkins are priced according to their weight, so the farmer would like to estimate the mean weight of the pumpkins he grew this year. He randomly selects 8 pumpkins and weighs them. Here are the weights (in pounds) of these pumpkins:
This dot plot shows the mean weight of 100 samples of eight pumpkins, similar to the one above.
What does the dot plot of the sample means suggest about how accurate an estimate based on a single sample of 8 pumpkins might be?
7.SP.4
7.SP.3
6.SP.5.c
1
7.
A farmer grows 5,000 pumpkins each year. The pumpkins are priced according to their weight, so the farmer would like to estimate the mean weight of the pumpkins he grew this year. He randomly selects 8 pumpkins and weighs them. Here are the weights (in pounds) of these pumpkins:
This dot plot shows the mean weight of 100 samples of eight pumpkins, similar to the one above.
What do you think the farmer might do to get a more accurate estimate of the population mean?
7.SP.4
7.SP.3
6.SP.5.c
"Source: Open Up Resouces (Download for free at openupresources.org.)"