Plate Tectonics Analyzing Maps Lab
By DANNICA JEANE PEREZ
starstarstarstarstar
Last updated over 5 years ago
35 Questions
Note from the author:
Adapted from the http://plateboundary.rice.edu/home.html activity
Pre-Lab Questions
1
1.
What is a plate boundary?
1
2.
The study of earthquakes is called ____________________.
1
3.
The study of volcanic activity is called ____________________.
1
4.
The study of how old the Earth's crust is called ____________________.
1
5.
The mapping of geologic features on Earth is called ____________________.
1
6.
Geography encompasses all of the following: (select all that apply)
1
7.
Plates that move away from eachother are called________________.
1
8.
Plates that move towoard from eachother are called________________.
1
9.
Plates that slide past eachother are called________________.
Lab Instructions:
Carefully analyze the maps below to answer the questions. To get full credit, you must write in full sentences and include multiple pieces of evidence to support your answer (patterns & comparison questions).

1
10.
What does this map show?
1
11.
What do the colors on the map represent?
1
12.
Red dots mean ____________________ earthquakes, and blue dots mean________________ earthquakes.
5
13.
Draw ORANGE lines to show where there are patterns of earthquakes. Then mark an X in 2-3 places where there are large concentration of earthquakes.
1
14.
There is a correlation between plate boundaries and earthquakes.
3
15.
What patterns do you notice when comparing the seismology (earthquake) map and plate boundary map?

1
16.
What does this map show?
1
17.
What do the red dots on the map represent?
3
18.
Draw GREEN lines to show where there are patterns of volcanoes.
1
19.
There is a correlation between ____________________ and ________________. (Select all that apply)
3
20.
What patterns do you notice when comparing the volcanology map and plate boundary map?
3
21.
What patterns do you notice when comparing the seismology (earthquake) map and volcanology map?
1
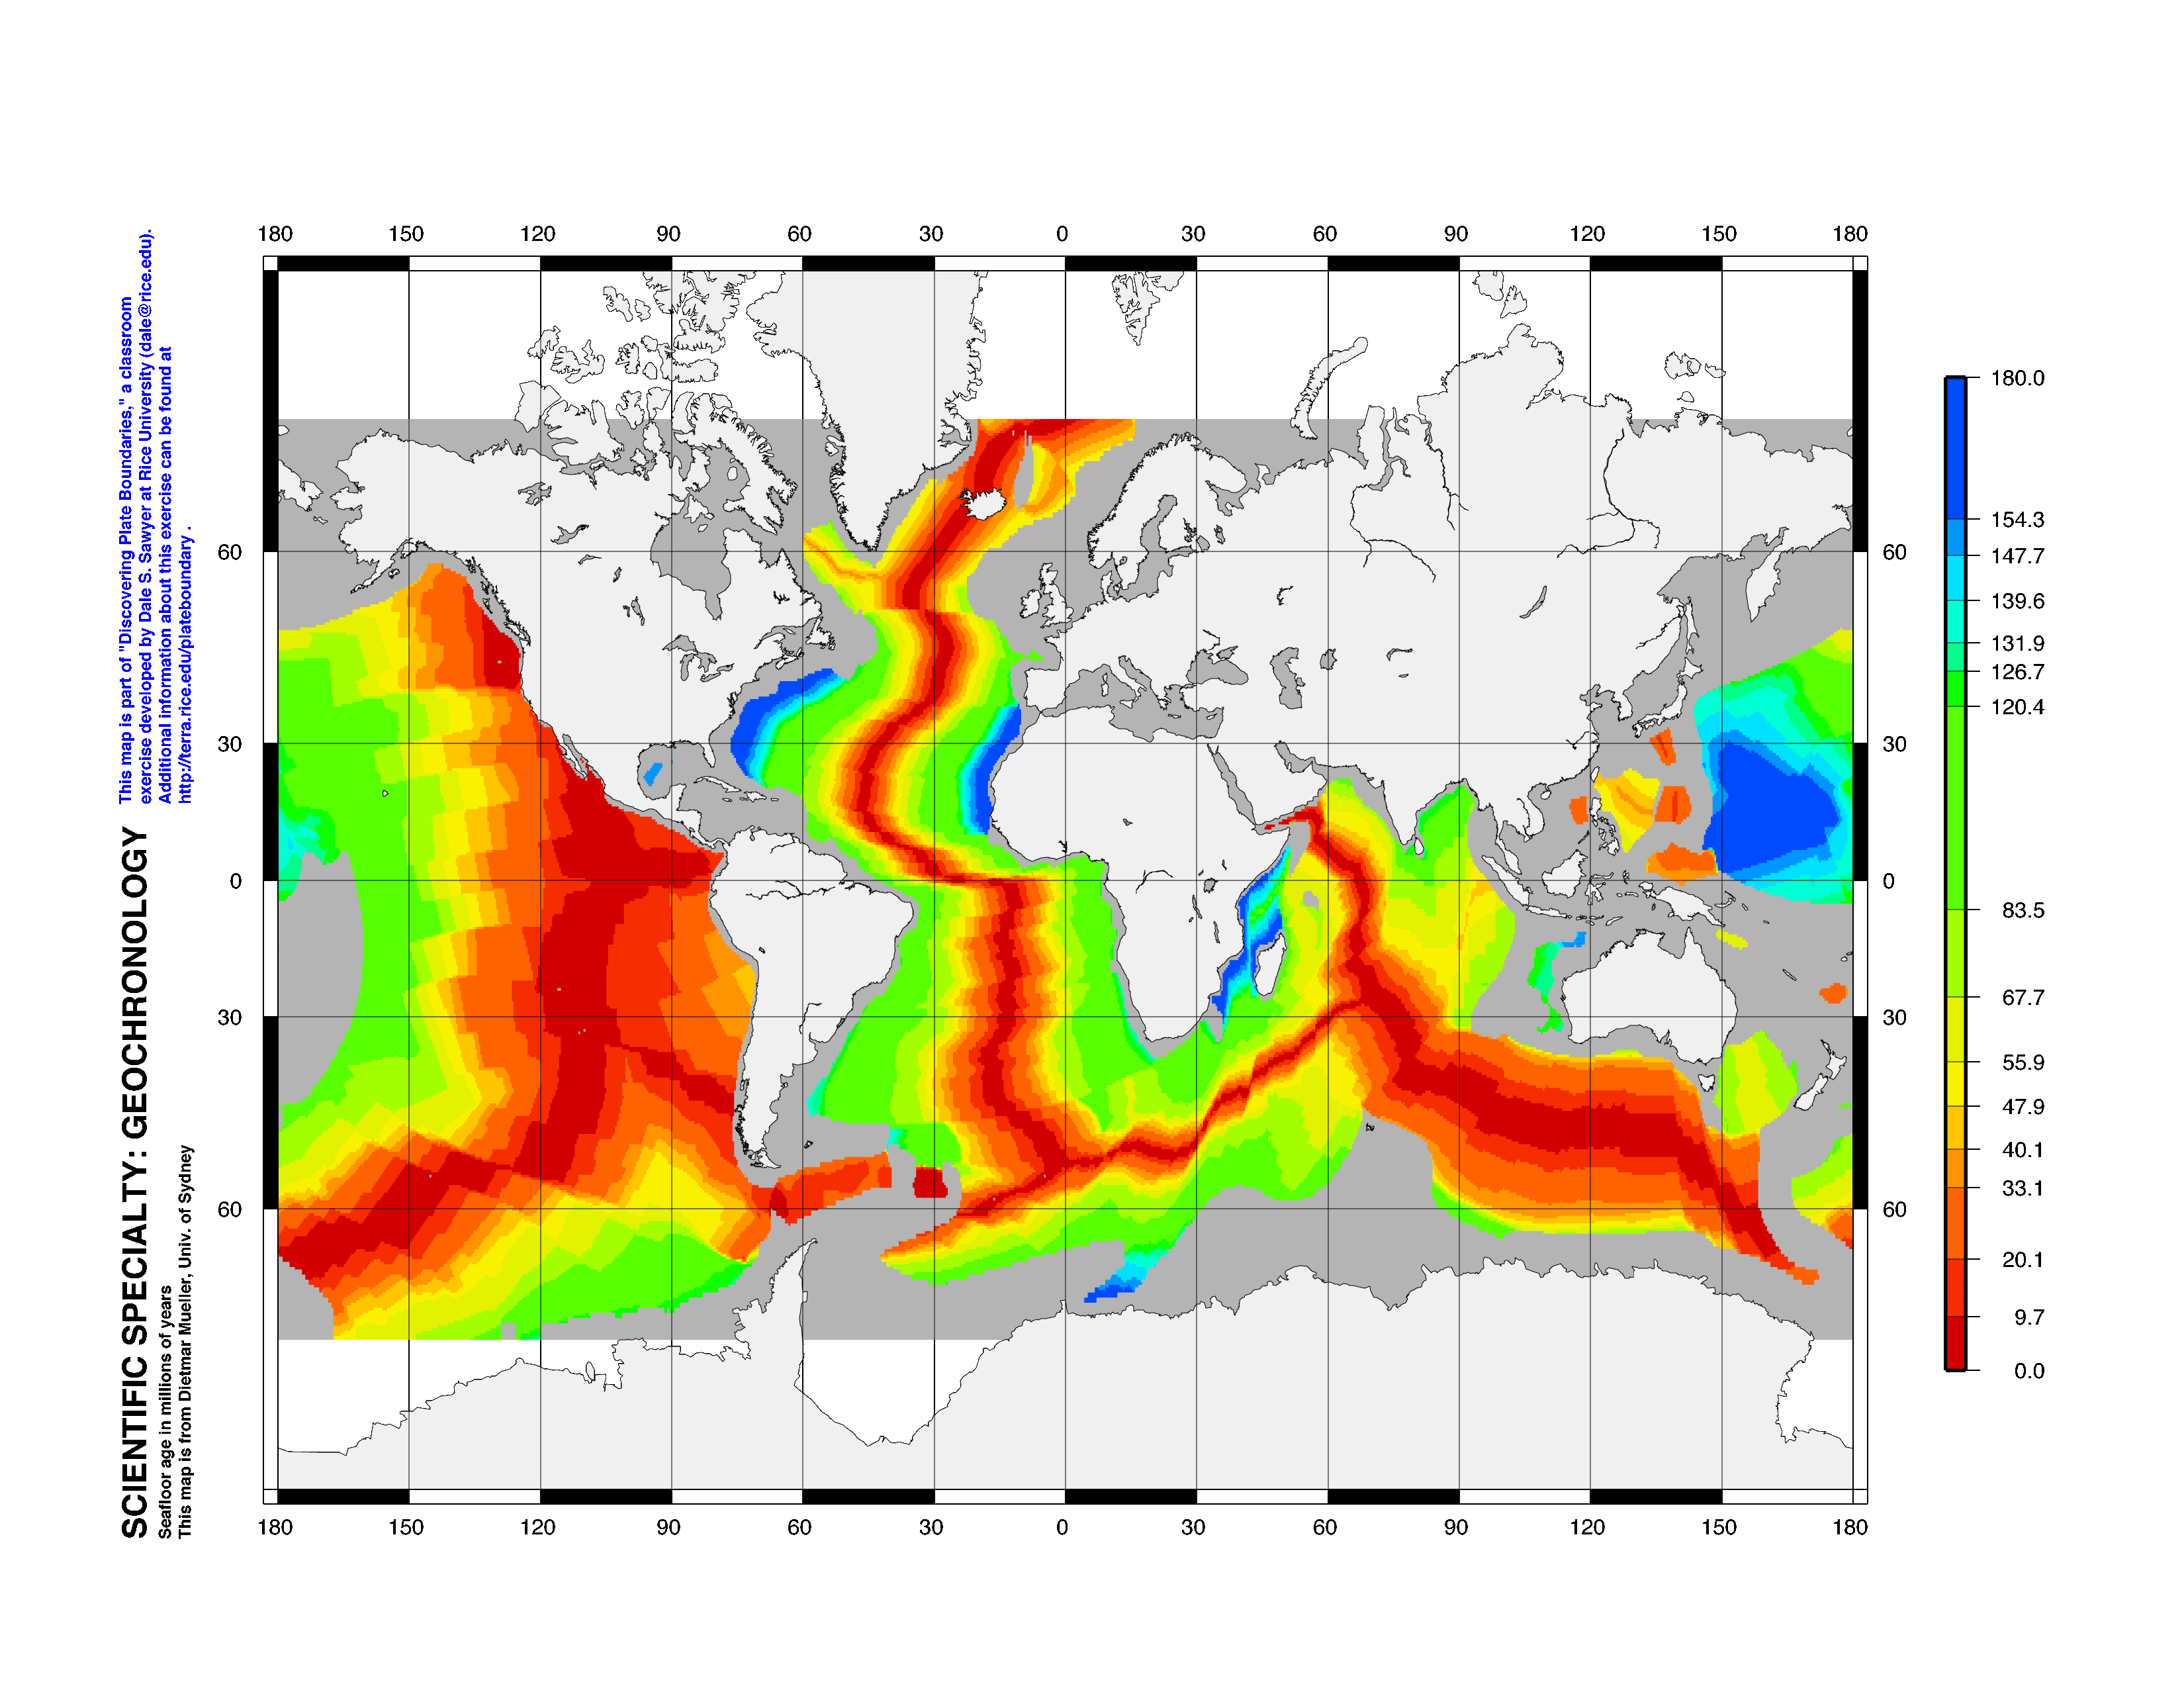
22.
What does this map show and in what units?
1
23.
The red areas on the map show ________________ crust, while the blue & green areas show _________________ crust.
5
24.
Draw YELLOW lines to show where new crust is being created. Then draw BLACK arrows to show which way the Earth's crust is moving in these areas to create new crust.
1
25.
The areas where new crust is created is called: (select all that apply)
3
26.
What patterns do you notice when comparing the geochronolgy map and volcanology map?
1
27.
What does this map show and in what units?
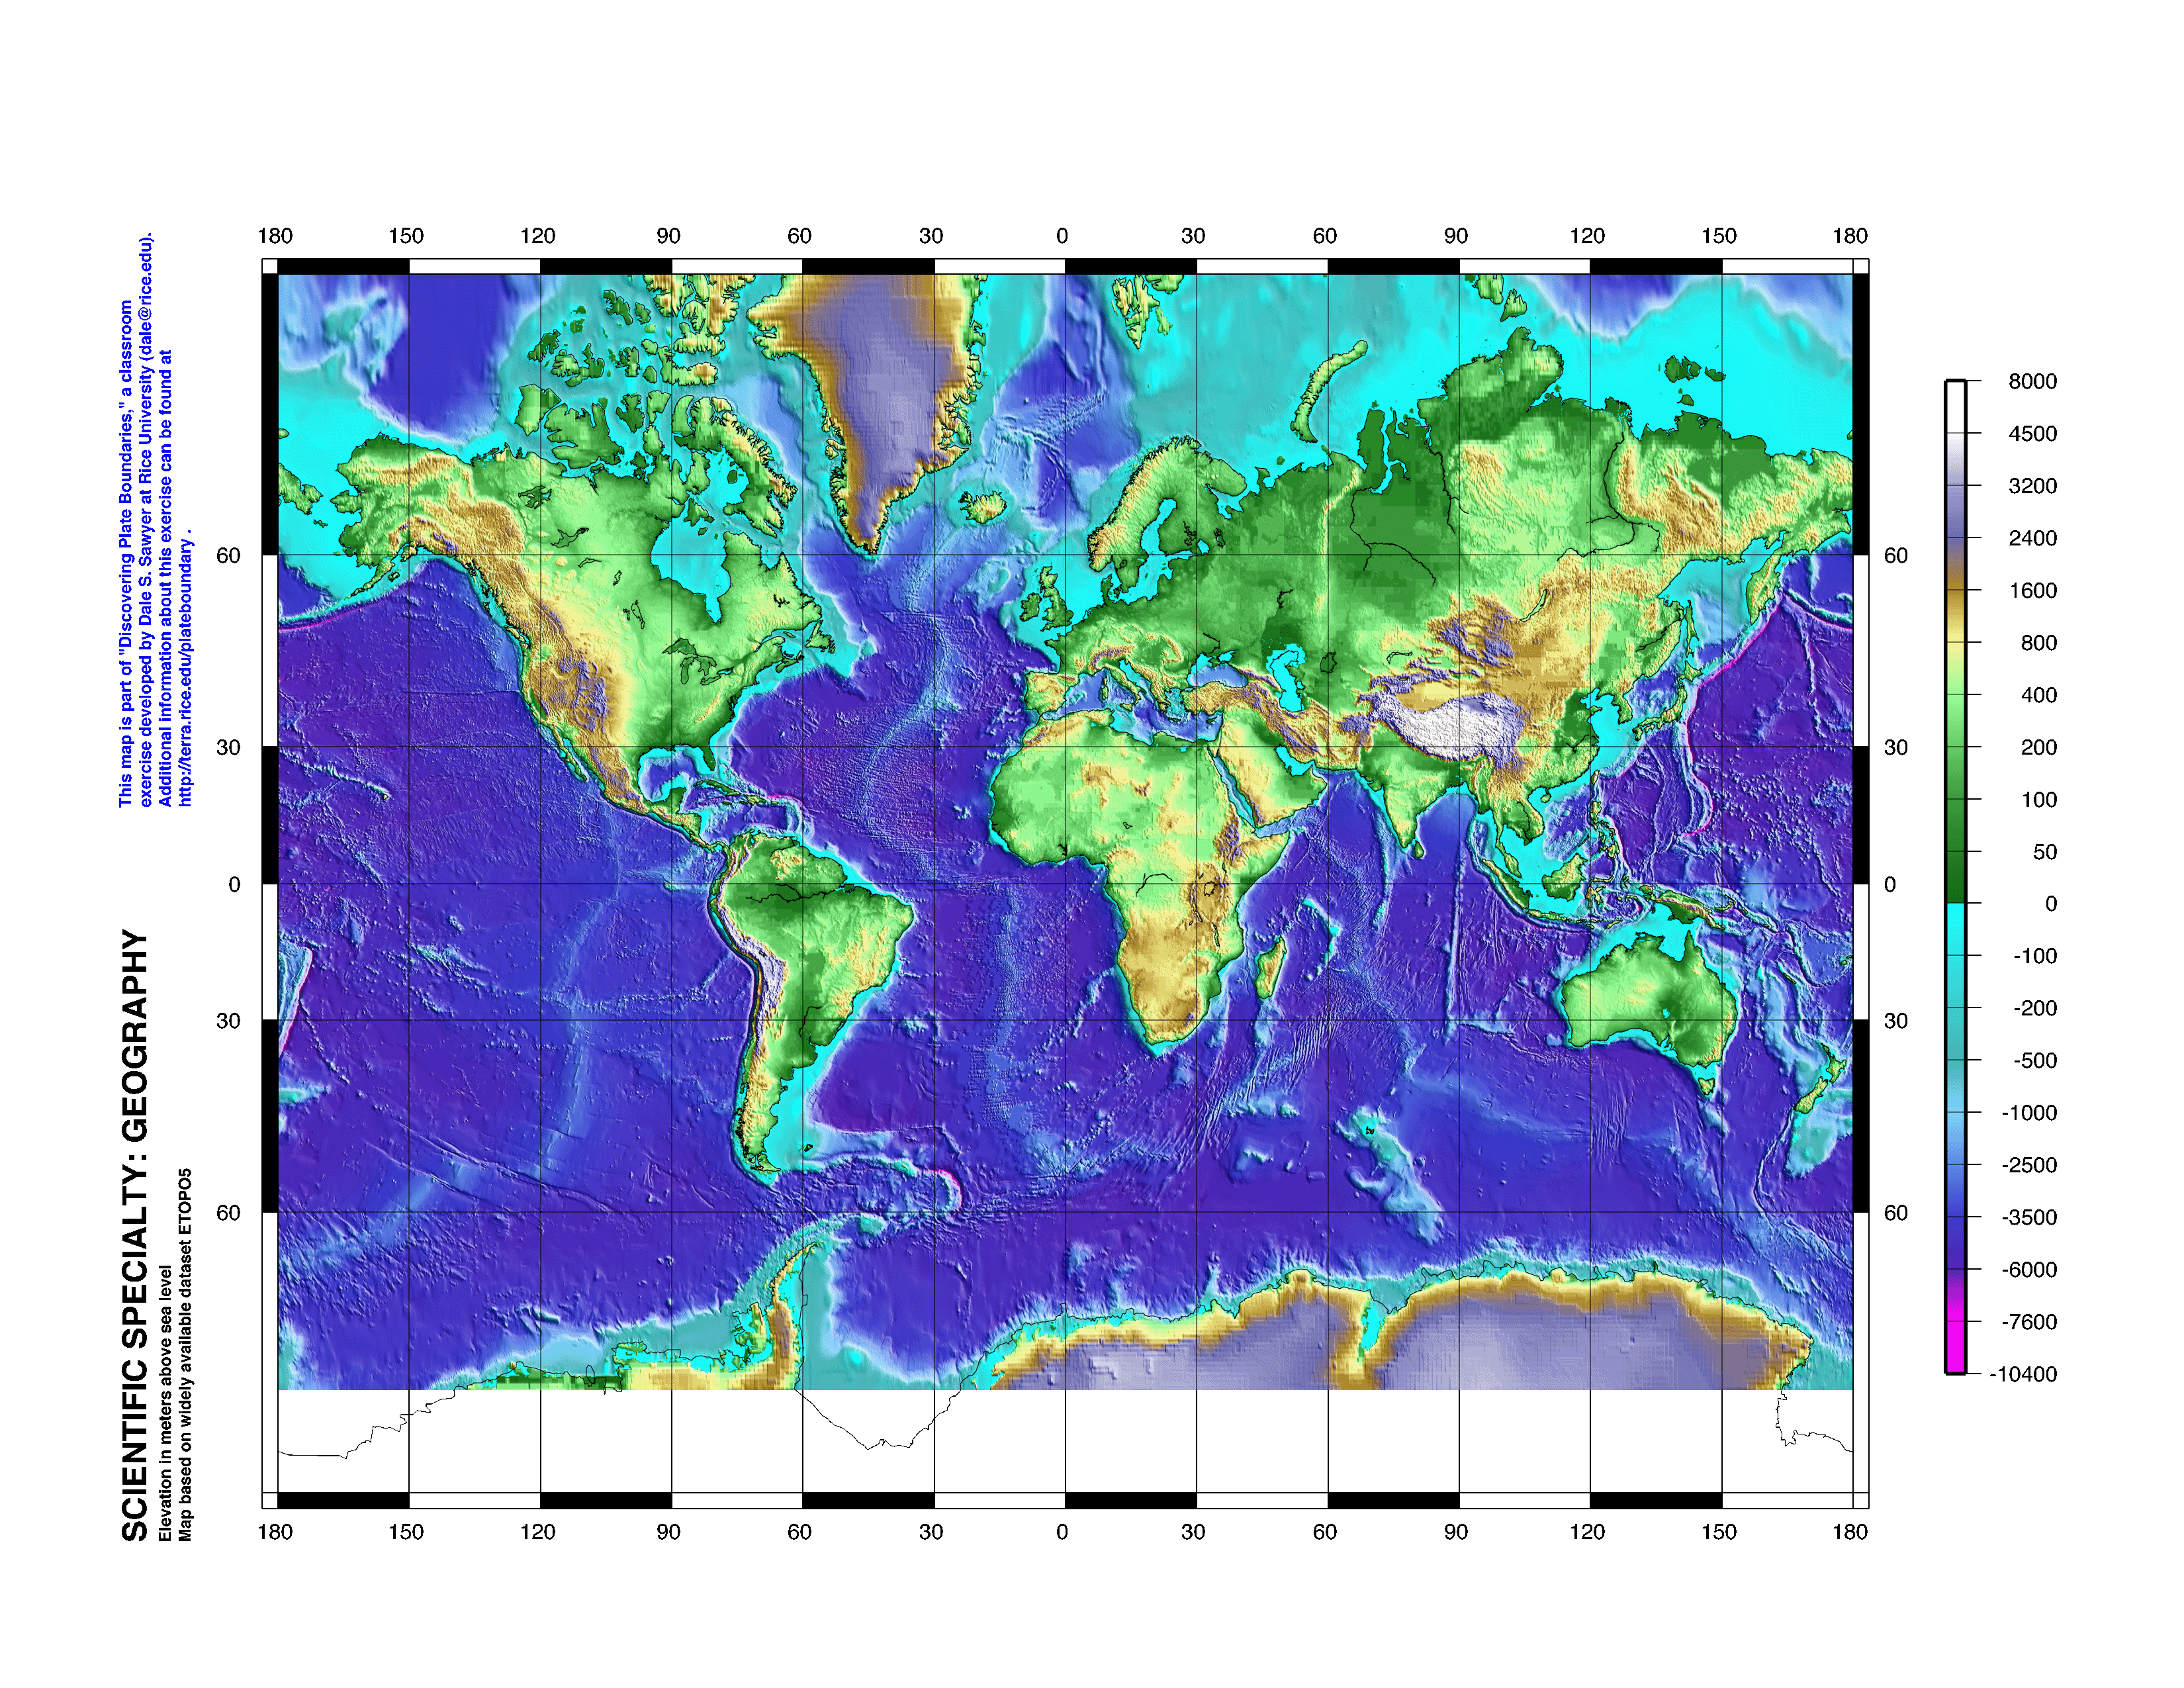
1
28.
The areas that are dark blue & white show lower elevations.
1
29.
From the map, the lowest places on the Earth are: (select all that apply)
1
30.
Areas with higher elevation will have/ be
5
31.
Circle the areas with the highest elevation with LIGHT BLUE. Then mark an X in ORANGE for the areas with the lowest elevation.
3
32.
Compare the geochronolgy map and the geography map. What patterns do you see?
1
33.
Compare these maps to the Geography map above. What patterns do you notice? How are all three maps related?
Post Lab Questions (worth 21 points alone):
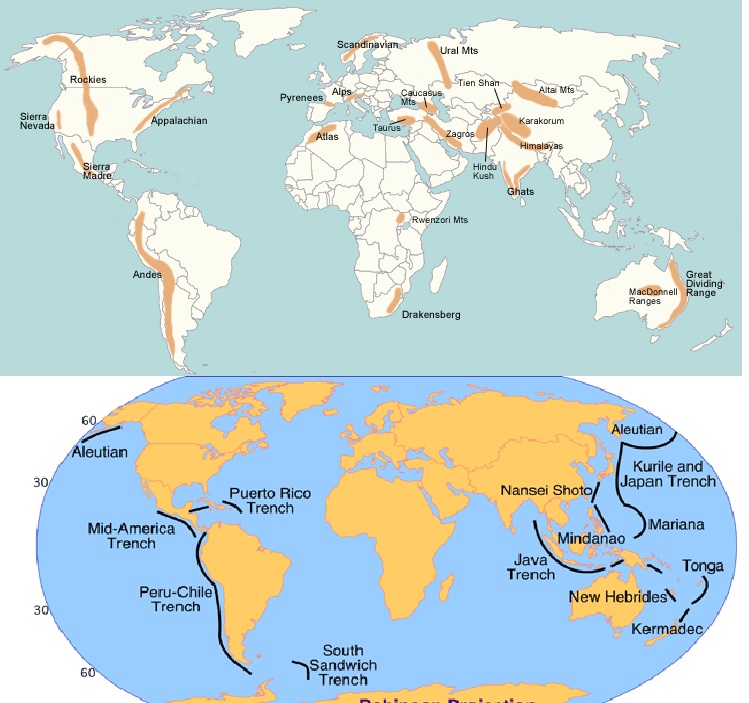
15
34.
Use your completed maps above to label the following:
1. Label in BLACK one convergent plate boundary, one divergent plate boundary, and one transform plate boundary. Use arrows to show the direction the plates are moving.
2. In ORANGE circle two areas with the most earthquakes.
3. In YELLOW draw three lines that show large chains of volcanoes.
4. In GREEN mark an X for three sea-floor spreading centers.
5. In PINK mark an X for the mountain range with the highest elevation.
6. In LIGHT BLUE mark an X for two of the deepest trenches.
6
35.
Write a CER to answer this question: What is the relationship between earthquakes, volcanoes, sea-floor spreading, and geographic landforms?